
We aim at analyzing the influence of incentive policies on renewable energy deployment in European Union countries and Turkey over the 2000–2018 period. Applying both panel fixed effect and the dynamic panel estimation methods, we compared the results of these two different techniques. Moreover, we included “net metering” that has not been analyzed before, in our policy toolkit, that includes a large number of incentives. Our data cover longer time series than the previous studies in the literature, and it provides new results of different renewable energy policies and drivers for analyzed countries. Empirical findings show that while grants, Research and Development, tax, certification, and policy support have positive and statistically significant impacts on the renewable energy capacity, direct investments, loan, and net metering instruments have no stimulating effect on the renewable energy deployment. These results indicate the deterrent impact of regulations and direct investments on capacity of electricity generated from renewable energy. Moreover, our estimation results reveal that fossil energy consumption, nuclear energy, and GDP are important drivers of renewable energy deployment while net import (energy security) and CO2 emissions are not. Our study highlights the importance of research and development activities, tax incentives, and efficient policy design in transition to green economy in the countries analyzed. Following the detailed discussion of the results, possible policy implications are presented at the end of the study.
Avoid common mistakes on your manuscript.
Global warming and increasing environmental degradation became important concern in the world in the last 3 decades. Since increasing greenhouse gases (GHGs) pose a global problem, the world countries seek for solutions at global level organizing meetings such as the “United Nations Conference on Climatic Change in 1992” and “Paris Conference in 2015.” The Kyoto Protocol in 1997 and Paris Agreement in 2016, which are the two important agreements resulting from these conferences, aim at mitigating the GHG emissions and keep the rise in global average temperature to well below 2 °C. According to those agreements, each country must design a specific plan to fight against global warming (UNFCC 2020; Wang et al. 2022). Moreover, to ensure energy supply security and mitigate the environmental deterioration, United Nations (UN) adopted a universal call to ensure “access to affordable, reliable, sustainable, and modern energy for all” (7th Sustainable Development Goal—SDG7) (UN 2021; Ioan et al. 2020). Many countries try to diversify their energy supply by developing alternative energy sources such as wind, solar, and biomass due to most worrying environmental problem—climate change—in the world and oil crises occurred during the 1970s. In this context, initiatives have been observed in recent years and investments are accelerated in the renewable energy (hereafter RE) sector in many countries including the European Union (EU) countries. It is expected that the replacement of fossil fuels with RE technologies will play a key role in achieving energy security, environmental stability, and SDG7 (Aquila et al. 2017; Murshed et al. 2020, Al-mulali et al. 2015, 2016.
The RE has become an alternative to fossil fuels and nuclear energy; however, there are also controversial arguments about whether production of the RE should be encouraged with policies or not, if so, which incentive tools should be utilized (see Harjanne and Korhonen 2019). In this respect, it is important to analyze the effectiveness of implemented RE policies used in promoting the RE installed capacity. The International Energy Agency (IEA) (2020) has recently emphasized on the negative impacts of Covid-19 pandemic for its decelerating role on the RE investment in the world. However, it is also highlighted by the IEA that the share of RE in electricity generation improved following the lockdown measures. Hence, to examine the effectiveness of RE, incentives has gained more importance than ever. As stated by Liu et al. (2019), there are numerous studies that qualitatively evaluate the effectiveness of RE policies; however, few numbers of quantitative work have discussed the role of RE policies in the literature.
We focus on the EU countries in this paper as Joint Research Centre JRC (2019) and indicate them as the top 6 emitters in the world along with China, the USA, India, Russia, and Japan. The EU countries have so far consumed 80% of the total amount of fossil fuel and emitted 67.5% of the total CO2 emissions globally. Despite the downward trends in GHG emissions, CO2 emissions per capita in EU are still above the world average (JRC 2019). The EU countries have very enthusiastic RE policies, since they desire to be at the leading position in research, development, and consumption of renewables in the world (Wang and Zhan 2019). For example, as stated by Borawski et al. (2019), the EU has 30% of the patents regarding RE in the world. According to the EC (2020) data, the share of the RE nearly doubled over the 2004–2018 period in the EU. As a candidate county, Turkey plans to meet two-thirds of its electricity consumption from RE sources by 2023 as well (PWC 2012). As EU countries have made significant progress in promoting RE, their experience will guide other countries in the world. Moreover, since Turkey is a candidate country to EU membership, findings of the paper will contribute to harmonization of regulations in membership process. Moreover, boosting RE sources contributes to energy security and promotes sustainable economic development. Hence, the current paper focuses on the EU countries and Turkey. Furthermore, although there is a general consensus related to the critical role of RE sources in mitigating the global warming in the relevant literature, however, it is still considered to be economically and technologically disadvantageous (Liu et al. 2019; Aquila et al. 2017).
The current paper analyzes how the RE policy tools (incentives) affect the installed capacity of the RE sources (electricity from solar, wind, geothermal) in EU countries and Turkey. There are few empirical studies that examine the role of RE incentives in RE deployment for EU in the literature. These studies either investigated the impacts of incentive schemes on RE capacity using panel data analysis (see Nicolini and Tavoni 2017; Marques et al. 2010; Jenner et al. 2013; BolkesjØ et al. 2014; Kilinc-Ata 2016) or examined the drivers of RE through dynamic panel data (see Zhang 2013; Marques and Fuinhas 2011a) and reveal controversial results. In the case of Turkey, there is no research paper that empirically analyzes the effectiveness of RE policies in RE deployment. Unlike the previous studies, we employ both panel data methods and compared the obtained results to strengthen empirical findings. In this context, findings of the current paper will contribute to design effective RE policies as a significant component of national planning in both developed and developing countries (Bölük 2013; Murshed et al. 2021).
Our contribution to the previous literature is manifold: first, this paper is the first attempt, to the best of our knowledge, that analyzes the effect of “net metering” incentive on installed capacity. Although “net metering” has been already put into force in 13 EU countries, no study empirically has examined the role of it in RE deployment yet. Second, existing studies either analyze the effectiveness of implemented RE incentive schemes (with some control variables and static panel data) or attempt to determine factors that affecting the installed RE capacity with dynamic approach. Against the previous studies, this study employs both static and dynamic panel data and compares the obtained results of two models. Dynamic panel data approach allows us to investigate the impact of different factors on the RE for different countries in the EU, while controlling the persistent effect of lagged RE variable. Moreover, few numbers of empirical studies, which employed dynamic panel approach, focused on the EU countries (only Marques and Fuinhas 2011b). As mentioned above, current paper extends the study of Marques and Fuinhas (2011a), by employing two different panel data models for European countries and comparing the obtained results. Third, the time interval of our dataset is longer, covering the period of 2000–2018, and contains more recent observations compared to the previous studies in the literature.
In this research paper, we are looking for answers to the following issues that will contribute to efficient energy policy design and sustainable economic development:
The rest of the paper is organized as follows. “Current status of RE in the European Union and Turkey” section discusses the development of RE in EU and Turkey as well. “Literature Review” section reviews the related literature discussing the effectiveness of RE incentives. “Data and methodology” section presents the data and econometric methodology adopted. “Results” section reports the results of the panel data analysis, and the final section concludes.
The first conceptual framework for RE in Europe and targets about its share in the EU gross energy consumption were proposed in the “White Paper” and the “Green Paper” published by the European Commission in the 1990s. However, the insufficient progress in RE capacity until the 2000s led the EU to prepare the first directive. Actions in the EU, related to renewable energy, commonly have been driven by the directives. The first two directives published in 2001 and 2003 state that the production and consumption of RE sources are important for sustainable development. The third directive (2009/28/EC) was published in 2009 as a revised version of the first two directives. This directive establishes an overall policy to generate energy from RE sources in the EU. It requires the EU to meet at least 20% of its total energy requirement with RE by 2020—to be achieved through the attainment of individual national targets. According to aforementioned directive, the EU countries must meet minimum binding target of 10% RE share in the transportation sector by 2020, as well (EC 2009).
The fourth directive is entitled as the “Revised Renewable Energy Directive” published on 30 November 2016. Within the scope of this directive, it is requested from the member states to make the EU a world leader in RE production and to increase its share in final energy consumption to 27% by 2030. As a part of “Clean Energy for all Europeans” plan, the revised RE directive 2018/2001/EU came into force in December 2018. Revised RE directive aimed at keeping the EU as a global leader in RE by encouraging member states to meet its GHGs commitments agreed under the Paris Agreement. The Europe 2030 target has been planned through “2030 Climate and Energy Framework.” In this framework, the Europe 2030 target share for RE is “at least 32% of final energy consumption with a clause for a possible upwards revision by 2023.” Moreover, 40 % cuts in GHG emissions (from 1990 levels) and 32.5% improvement in energy efficiency was established in EU by 2020 (EC 2018).
Within the framework of these directives, the EU countries have been obliged to make a “National Action Plan (NAP).” Under NAP, member states must submit their progress on RE to the European Commission in 2-year reports. The European Commission must monitor the development and prepare the progress reports of the member states. Since member states in EU have different energy sources and different energy markets, NAPs are also different in terms of the content.
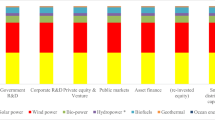
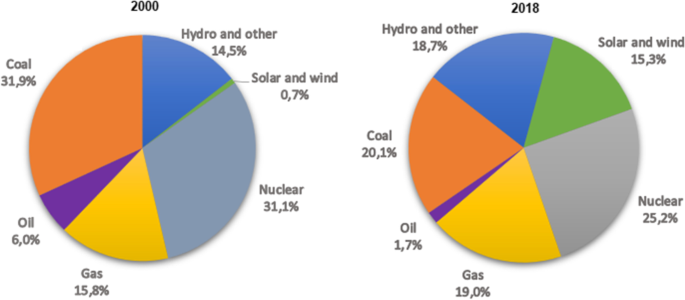
Fig. 1 is prepared using the statistics at IEA database and it shows how EU has replaced fossil fuels with RE since 2000. The European Commission reports that the share of EU energy obtained from RE sources in final energy consumption reached to 18% in 2018 that is more than double of the relevant amount in 2004 (8.5%). The share of RE in overall final consumption of energy is one of the key indicators of the European 2020 energy strategy (EC 2018).
Since the 2000s, as an EU candidate country, Turkey has started to introduce regulatory arrangements of the energy market. In Turkey, the rate of dependency increases with each passing year due to the increasing demand for energy. Foreign dependency in energy consumption has increased the importance given to the issue of energy supply security and has made it necessary to formulate energy supply strategies and to be implemented by supporting them with energy policies. The most important development regarding RE has been with the enactment of the Law on the Use of RE Resources for the Purpose of Electric Energy Production (YEK), dated 10.05.2005 and numbered 5346. With this law, what are the RE sources are defined and some incentives have been brought to these sources. The 11th Development Plan (DP- in 2019) constitutes the roadmap for RE deployment in Turkey. In this DP, it is envisaged that share of RE will rise to 38.8% until 2023 (Erdin and Ozkaya 2019). Therefore, the RE investments would play important role in mitigating high import dependency and fulfilling the emission commitments for Turkey.
Table 1 presents the RE policies implemented in the EU and Turkey. Policy indicators are compiled from the IEA/IRENA Policy and Measures (PM) database which comprises policy measures for the EU countries from 2000 onwards. As seen in Table 1, tax incentives, feed in tariff, loans, and obligations have been most adopted support schemes among the others. The incentive schemes will be discussed in detail under the Section “independent variables”.
RES-E capacity data have been obtained from the IRENA database. Policy (incentive) variables have been compiled from the IEA/IRENA Policy and Measures database. Control variables in our analysis are obtained from the US Energy Administration (EIA) and the World Bank. The entire data set covers the period of 2000–2018 for the EU countries and Turkey.
Table 3 presents the definition of variables and the descriptive statistics. These indicators of RES-E have been commonly used by scholars to examine the impacts of aggregated policy instruments in the literature (see Table 1 and 2).
Table.2 Definition of variables, sources of data and descriptive statisticsAs seen in Table 2, we have 513 observations for all kind of RE installed capacity. Among the others, wind energy has the highest mean.
The recent studies focusing on the effectiveness of RE incentives have generally carried out panel data analysis. In the same way, we have employed a panel data model to analyze the link between policy incentives and RE deployment. Using a data set covering 2000–2018 period for the EU countries, we have initially employed a panel fixed effect model. Our data set covers 25 member states including Austria, Belgium, Bulgaria, Croatia, Czech Republic, Denmark, Estonia, Finland, France, Germany, Greece, Hungary, Ireland, Italy, Latvia, Lithuania, Luxembourg, the Netherlands, Poland, Portugal, Romania, Slovakia, Slovenia, Spain, and Sweden. Malta and Cyprus were excluded from the model because of having insignificantly small data. Panel fixed effect estimator is used since the unobserved heterogeneity is constant over time (Kilinc-Ata 2016) and renewable electricity capacity can be affected by unobserved characteristics. In addition to panel fixed effects, the dynamic panel data model is estimated as well. Dynamic panel data models contain the lagged of the dependent variable as one of the explanatory variables. In our case, we believe that the installed capacity of the previous periods may positively affect the RE capacity of the current period. This method yields more efficient parameter estimates than the i.i.d. error model in the traditional static fixed effect estimator by ensuring the following advantages: (i) it eliminates the individual non-observable effects of countries; (ii) it solves endogeneity among independent variables, since their lagged values are used as instrumental variables, (iii) it handles collinearity among variables; and (iv) it allows us to test whether installed RE capacity in the current period is significantly correlated with the previous renewable capacity (He et al. 2018; Marques and Fuinhas 2011a).
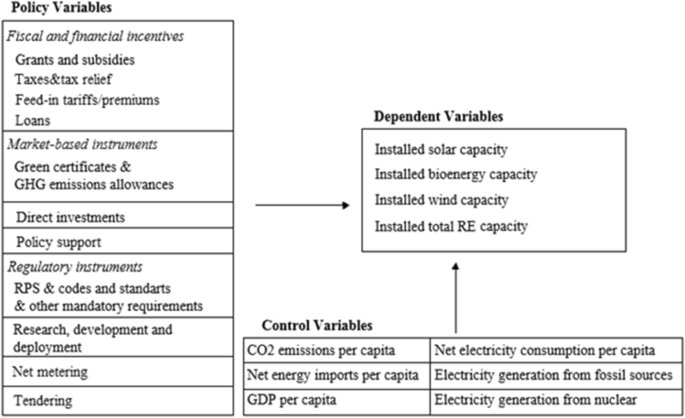
The variables incorporated into model are log-transformed to fix for the skewed distribution of both dependent and explanatory variables (Hair 2010). It is expected to see a positive effect for every subset of incentive measure on the installed capacity of RES-E. The components of the model are classified and presented in Fig. 2 as well.
Panel data model with one lag procedure is as following:
In Eq. 1, dependent variable RECyit is the electricity generated from RE sources (RES-E) installed capacity. y stands for the RE sources (bio, solar, wind, and total renewable), i stands for the country, and t for the year. As independent variables in the panel data model, we include different policy measures, plus some other control variables. These policy measures are represented by Pyit-1 that is a vector of explanatory variables. Incentive policies cannot increase the generation immediately or this process could take up to 1 or 2 years. The reason for the delay is that investment process such as wind turbine or solar panel installation and the legal authorization procedure could take a long time. For this reason, we take one lag for applied policies and other control variables in current study. j represents a type of policy measure such as feed-in tariffs, grants and subsidies, loans, taxes, tradable emissions certificates, policy support, regulatory requirements, R&D, net metering, and tendering. We incorporated several variables that explain economic and political aspects, as well as energy-specific considerations that may affect the production of RE. Those coefficients of control variables are as shown by δk, where K is a vector including different control variables such as the logarithm of net energy imports per capita, the logarithm of GDP per capita, the logarithm of CO2 emissions per capita, the logarithm of net electricity consumption per capita, and the logarithm of electricity generation from fossil sources and nuclear. We included country dummy (di) and time dummy (dt) into model as well. εyit is the identically independently distributed error term with the variance σ 2 .
In different models, we use several dependent variables such as the installed total RE capacity and other RE capacities (see Fig. 2) to analyze the impacts of different incentive tools (economic instruments, regulatory instruments, policy supports, etc.) on RE deployment.
The current research paper also tests whether there is a persistence effect in installed RE capacity. There may be positive relationship between installed capacity in the previous (RECt-1) and current periods (RECt) since these large investments cannot be a decision for months or even for a year (Beck and Joshi 2015). Therefore, we estimate Eq. 2 using a dynamic approach called generalized methods of moments (GMM). Similar to Eq. 1, we have included some common economic and political variables such as GDP per capita, net electricity consumption per capita, CO2 emissions per capita, net energy imports per capita, and electricity generation from fossil sources and nuclear as controls.
As we mentioned before, dynamic panel data estimation process employs lags of dependent variables to be explanatory variables. By doing so, lagged values of the dependent variables become instruments to control endogeneity. Hence, we use the generalized methods of moments (GMM) to obtain efficient and consistent results under the presence of different kinds of endogeneity (for example, endogeneity of lagged dependent variable and other potentially endogenous explanatory variables). Moreover, we avoid unnecessary data loss. Therefore, this method improves the heteroskedasticity problem and creates efficient and unbiased results (Kukenova and Monteiro 2008; Beck and Josji 2015):
$$The equation for the model is a modified version of Arellano–Bover/Blundell–Bond GMM dynamic panel data and helps us to understand how economic variables and variables related with energy security and environment (e.g., GDP, CO2 emissions, energy consumption, and nuclear energy) affect the installed RE capacity in the EU countries. The model covers the AR(1) and AR(2) test to find evidence of serial correlation of the error term. If a country has a dependency on energy imports, we expect to confirm that its investment in renewable resources has increased. We expect a rise on RE use and capacity when income level is rising because a greater level of income means greater potential source for RE investments. A vast majority of literature suggests that environmental concerns promote the widespread use of RE, so we expect to conclude that greater CO2 emissions mean greater RE capacity. Finally, as the electricity generation from fossil sources and nuclear increases, we expect a decrease at the share of renewables.
Dependent variable for overall econometric model is measured as total installed capacity (in MW) of RES-E in a specific country and year in a specific subsector such as wind, solar, and biomass. Although some studies used the RE generation, added capacity, or percentage of RE in total energy supply as an indicator of the RE development (see Table 3), we use RES-E capacity values since capacity is accepted as better proxy for RE deployment (see Popp et al. 2011; Polzin et al. 2015).
Table.3 Dependent variables in literatureAs presented in the Table 3, installed capacity has been commonly used as an indicator and/or measure for RES-E in the literature.
The RE policy instruments (Pyit-1) are critical explanatory variables that include direct investment, feed-in tariffs/premiums, grants and subsidies, loans, taxes and tax relief, GHG emissions trading and tradable certificates, policy support, regulatory requirements (codes and standards, monitoring and obligation schemes), research and development and deployment, tendering, and net metering measured at country-year level. The data of those variables are obtained from IEA/IRENA database. Policy instruments are represented by dummy (binary) variables that take 1 if a country adopted the relevant policy instrument (such as FIT, taxes, and R&D) and zero otherwise. In other words, 11 policy variables will take the value of 1 after the implementation of policy and 0 before. In the current study, dummy variables are preferred to “accumulated number of RE policies and measures,” since having a greater number of policies does not necessarily mean that countries apply effective/and or successful RE policies.
As mentioned on Table 4, there has been no study that analyzed the effect of “net metering” incentive on RE production. This paper, however, evaluates the impact of this commonly used incentive on renewable capacity generation. As presented in Table 1, 13 countries have already included this instrument into their incentive policies in the EU.
Table.4 Independent variables in the literatureBefore proceeding with the analysis, it would be useful to give information on the policy instruments in detail to better understand the interaction between RE policies and the RE development.
Grants and subsidies: Grants are amounts that generally do not need to be repaid but must be used for specified purposes. Grants for RE are normally awarded by local governments, public organizations, or non-profit organizations to fund feasibility studies, research and development activities, system installation and operation, and business development activities. Grants can also be combined with mixed policies, and subsidized loans to support the expansion of RE and energy efficiency. Apart from the “grants,” subsidies refer to direct aid, tax cuts, and other special assistance that governments give businesses to reduce operating costs in the long term. The main rationale for subsidizing is to encourage costly investment for businesses. Capital subsidies in RE can be used to help create a level playing field with conventional energy technologies and lower initial capital costs (IRENA 2018: 71-72).
Tax exemption is generally applied as a fiscal incentive measure (see Fig. 2) to boost the RE investments in energy sector. Another incentive tool in tax policy is tax credits. Tax credits on purchase and installation of RE equipment facilitate the penetration of RE deployment into the market. A tax credit is a sum of money that taxpayers can deduct from taxes they are obliged to pay their government. The advantage of tax credit is to reduce the total debt burden and fossil fuel utilization. For example, a carbon tax increases the cost burden for burning of fossil energy and facilitates the investments in RE (Abolhosseini and Heshmati 2014; IRENA 2018:71).
Feed-in tariff/premium payment is a policy that specifies a payment per unit (e.g., USD per KWh) for RE generators with long-term contracts, usually for a fixed period of time (15–25 years). The fixed price guarantee (Feed-in Tariff) is an incentive mechanism in which the RE generators are guaranteed to purchase their electricity at a fixed price per kWh. In the feed-in premium policy, a premium guarantee is provided for the electricity obtained from renewable sources, that is determined slightly above the market price (REN21 2019: 244). Among the others, FITs are the commonly used support mechanism to accelerate renewable investments in the world. According to the Global Status Report by (REN21, 2020), around 113 countries had used FIT policy in 2019.
Loans: One of the biggest obstacles to investments in RE is given to finance the high initial capital costs of RE projects in the world. Financing assistance in the form of low-interest, long-term loans and loan guarantees plays an important role in the development of RE by reducing the cost of capital and effectively reducing the average energy cost per unit and investment risk (Assmann et al. 2006: 96).
Carbon pricing is a mechanism that tries to shift the burden of damage caused by carbon back to those responsible for it and those who can reduce it. There are two basic carbon pricing systems: emission trading systems (ETS) and carbon taxes. In the emission trading system, a limit (or an upper limit) is set for the total greenhouse gas emissions of greenhouse gas emitting facilities and enables low emission industries to sell their surplus allowances to firms that emit higher amounts. The ETS application sets a market price for GHG emissions, creating favorable market for emission allowances. The carbon tax sets a price directly on carbon by imposing a tax rate on GHG emissions and/or on the carbon content of fossil fuels (WB 2019).
The renewable portfolio standard (RPS) is generally applied with FITs. However, while FIT mechanism is price based (fixed-price and premium price ensured by the government), the incentive of RPS is quantity based. RPS mechanism imposes an obligation on electricity generation and transmission companies that a predetermined part of the electricity they produce or sell is obtained from RE sources. In this application, a certificate is given to the generators for every megawatt hour of RE produced to meet mandatory quotas (REN21 2019: 247; IRENA 2018:62). Unlike the FIT mechanism, RPS incentive relies on the private market for its execution. Hence, it can be said that there is a price competition among the different types of RE technologies (Abolhosseini and Heshmati 2014).
Net metering is an electricity billing mechanism that generates some or all of its own electricity and allows consumers with electricity generators to use the excess electricity power they generate later. This kind of incentives is often adopted to encourage the development of small-scale rooftop solar PV systems, rarely small-scale wind turbines (REN21 2019: 61). By the end of the 2019, around 70 countries adopted net metering policies in the world. Turkey started to implement net metering program for solar energy systems under 10 kilowatts (kW) of capacity in recent years (REN 21 2020).
The tender method (auction) is a procurement mechanism in which RE supply or capacity is requested competitively from vendors who offer bids at the lowest price they would like to accept. Offers can be evaluated on both price and non-price factors. Under a tender program, the regulatory authority declares that it wants to establish a specific capacity of a particular technology or technology suite. Project developers participating in auctions usually submit a bid with a price per unit electricity at which they can realize the project (REN21 2019:248; IEA 2011:35).
The regulatory policies aim to create environment that enables the switch to an efficient RE by binding legislations and setting targets. It includes government commitments to action such as roadmaps, action plans, and programs (REN 21 2020). Direct investments are related to infrastructure development such as integration of grids into RE by the government to minimize the transmission and fluctuation problems (Ding and Somani 2010:1-2). Generally, the RE investments are high-tech and costly investments. Therefore, technological support policies by governments are important to attract investments in this field. To encourage investment and innovation in the RE, governments need to focus not only on main climate policies, but also on broader investment conditions. Broadening the focus is particularly important in the context of the EU and the OECD countries as well as the ongoing reforms of incentive programs for the RE in emerging economies (OECD 2017: 12).
R&D support policies are crucial to develop new energy and efficiency technologies. R&D investments encourage the radical innovations and develop the RE capacity in energy markets (Mihaylov et al. 2019).
All of the RE support policies implemented by the EU members and Turkey are shown in Table 4. FIT policies still play a crucial role in efforts to scale up renewable power in many of the EU countries, particularly to develop smaller-scale projects and specific technologies. Although tradable energy certificates have been widely used among the EU members, Turkey has yet to start using this policy. Public investment, grants, and subsidies seem to be widely applied policy incentives by governments in many member states in EU.
Before explaining our main findings, we report the results of econometric tests conducted for the presence of unobserved country and time effects, heteroskedasticity, serial correlation, and cross-sectional dependency. Based on the test results reported in Table 5, we see the necessity of the country and time effects in the models with different dependent variables. Therefore, we conclude that OLS estimation of all models would produce biased results.
Table.5 Unit-time effects and Hausman testMoreover, it should be stated here that, since we have short panel data (micro panel, N> T), there is no need to do unit root test and cointegration (See Hayakawa 2017; Baltagi 2013). However, we apply Hausman test to determine whether it is appropriate to use the fixed effect (FE) or the random effect model for the estimation of those models. Test results support the use of FE for the models of solar, bio, and the total RE, while RE is suggested for the wind model.
After specifying the type of the model and estimator, we test for the heteroscedasticity, autocorrelation, and cross-sectional dependency. Cross-sectional dependency is tested using Pesaran’s CD test, Friedman’s test, and Frees test. In order to test autocorrelation, we use Baltagi and Wu’s locally best invariant (LBI) tests and the Durbin-Watson tests of Bhargava, Franzini, and Narendranathan. Finally, by applying modified Wald test, we check whether the heteroscedasticity problem exists or not for the fixed effect model.
We have found presence of heteroscedasticity, autocorrelation, and cross-sectional dependency for all the models as shown in Table 6. We used Driscoll-Kray nonparametric covariance estimator to correct these problems.
Table.6 Tests for heteroscedasticity, autocorrelation and cross-sectional dependenceAccording to the correlation matrix (see Table 10 in the Appendix), explanatory variables are not generally and highly correlated. Assuming there is one lag (for explanatory variables), the fixed effect model (Eq.1) regression results will be as shown in Table 7.
Table.7 The fixed effect model regression results with one lag (t-1)According to the results (see Table 7), FIT, while positively affecting the installed capacity of bioenergy and solar energy, it is not promoting the total RE installed capacity. Interestingly, when considering wind energy installed capacity, we also find a negative and significant coefficient of FIT for wind power. In addition, we find a significant positive impact of GRANT on wind and total RE capacity. LOAN displays a positive coefficient, which is however significant for wind power only. According to the results, while CERT has a positive coefficient for bioenergy and total RE, it has no stimulating effect on solar and wind power. We also find a significant and negative relationship between REG and total RE and bioenergy. As expected, we find that TAX and R&D has positive impact on RE capacity, except wind energy. POL positively effects the total RE capacity; however, it negatively influences the solar energy capacity. Unexpectedly, we observe a negative and significant coefficient for the regulatory instruments in stimulating the renewable deployment.
According to the results, MET and DIR policy are found to be ineffective for promoting RES-E capacity. The results from panel data analysis highlight that such incentives are ineffective in promoting RES-E installed capacity. Our results reveal that, among the others, R&D, CERT, GRANT, TAX, and POL are very important incentive mechanisms to develop the total RE. This stimulating effect is reflected by a high level of statistical significance at the 1% and 5% significance level and positive coefficients. However, these incentives appear to have mixed results for different types of RES-E. Lastly, as reported in Table 7, while TEN has positive impact on wind power, it affects bioenergy installed capacity negatively.
The next issue is to investigate which control variables increase the renewables. Results in Table 7 show that NETIMP is significant for the solar and the total RE, but contrary to expectations, its sign is negative. NUC has positive relationship with total wind and bioenergy. While GDPP positively affects wind capacity, it negatively affects bioenergy capacity. CO2 emission displays a positive coefficient for the solar power, which is however negative for the wind power. Our results show that the other controls such as NETCON, FOS, and NUC are found to be poorly significant.
To simplify the analysis of the results of all estimated models, we show all the estimated coefficients and their significance in Table 8.
Table.8 Coefficient sign and significance levels (Fixed Effects)As seen in Table 8, among the others, only R&D positively affects the production of both the total RE and all types of RE. Other RE policy incentives, however, have mixed results on the development of different RE capacity. If it is evaluated based on RE types, FIT, TAX, and R&D incentives are found effective for the solar energy. For the wind power, GRANT, LOAN, POL, TEN, and R&D incentives seem to be effective for capacity increase. Similarly, TEN, R&D, TAX, FIT, and CERT are found important policy tools to stimulate the bioenergy installed capacity. Considering the total RE, it has been revealed that GRANT, TAX, CERT, POL, REG, and R&D incentives increase the RE installed capacity.
Unlike the expectations, it seems that FIT has no significant effect on the total RE. FIT, however, has positive impact on solar and bioenergy installed capacity. As highlighted by Aquila et.al. (2017), regulatory instability and poorly designed energy policies can turn FITs into expensive incentive. Moreover, if prices are not set correctly, net metering can deprive the cash flow and low prices that do not fully reflect the technology cost will send a negative signal to the industry. It is argued by Aquila et al. (2017) and Zahedi (2010) that the incentives that increase the cost of construction of power plant and support mechanisms that do not have a guarantee of energy purchased by the government (e.g., RPS and quota) cannot be effective in deployment of RE.
Our panel data analysis provides mixed and interesting evidence for policy variables. Based on the empirical results, GRANT, TAX, CERT, POL, and R&D policies have been effective in promoting the renewable energy. That is to say, among the other group of incentives (see Fig. 1), it is found that fiscal and financial incentives significantly promote the RES-E power capacity. Our results are in line with the results of Liu et al. 2019. Moreover, according to our results, while REG negatively effects the RE installed capacity, FIT, DIR, METER, LOAN, and TEN have no significant effect on RE deployment. Regarding the FITs, if there is no guaranteed network access and long-term agreement, this incentive becomes ineffective mechanism. Moreover, subsidies such as LOAN are seen unstable since they depend on the government budget, but TAX makes RE investments attractive, especially in countries with high tax burden. Our findings are similar to Nicolini and Tavoni (2017) however contradict with results of Jenner et al. (2013), Kilinc-Ata (2016) and Bolkesjø et al. (2014).
Assuming there is one lag, autoregressive model regression results will be as shown in Table 9. As expected, installed renewable capacity in previous period positively affects the RE capacity in the current period. In dynamic panel model, RECt-1 stands for the previous year installed capacity of the RE. Moreover, high level of tariffs at time (t-1) period is positively linked to larger amount of installed RES-E capacity at time (t).
Table.9 Autoregressive model (Arellano–Bover/Blundell–Bond GMM estimator)Equation 2 is estimated using GMM. Table 9 depicts the results of GMM estimation and presents the relevant test statistics. Sargan test shows that restrictions created as a consequence of use of instruments are valid and therefore overidenfication does not exist.
The test for autocorrelation in the differenced error term AR(1) is significant and rejects the null hypothesis, following standard expectations for GMM model and suggesting that autocorrelation does not exist.
In examining 25 EU countries and Turkey, our results indicate that the lagged dependent variable RECt-1 is positive and statistically significant at the 1% level, indicating that high RECt-1 does occur continuously from the past to the future for all kind of RE sources installed capacity. As reported in Table 9, while GDPP and NUC stimulate the RE, CO2 decreases the total RE capacity. Interestingly, CO2 displays a negative and significant coefficient, indicating that increasing emissions do not pose an important driver for RE deployment. This result shows that countries prefer cheap fossil fuels to RE in energy utilization and/or mitigating GHGs has not been adequately integrated into RE policies in EU. Economic growth generates output increase that leads more energy consumption. As expected, our results reveal that GDPP positively affect the RE development: higher level of GDPP corresponds to larger amount of installed RES-E capacity. Countries with high national income give more importance to environmental problems and RE deployment than low-income countries. Moreover, higher fossil fuel and nuclear power consumption (substitute variables) stimulate the installed RE capacity. The effects of primary energy sources (such as coal, oil, and natural gas), overall energy consumption, and nuclear power are considerably significant, which is in line with the higher RE deployment. Our results are according to the previous studies such as Marques and Fuinhas (2011a), Gan and Smith 2011, Ackah and Kizys (2015), who found GDP to be important for RE deployment. Contrary to these studies, we find the effect of a national income to be positive. Moreover, our results contradict with the Bengochea and Faet (2012) who found CO2 to be positive for development of RE installed capacity.
The purpose of this paper is to investigate the effect of the RE incentive instruments on the installed RES-E capacity in 25 EU countries and Turkey during the period of 2000–2018. We set up a panel data set for each RE sources and total RE, considering 11 different incentive policy distinctions. Our analysis differs from previous studies because this is the first paper to analyze the effect of “net metering” instrument on installed RE capacity. Moreover, we have estimated both panel fixed effect and dynamic panel by employing a much larger panel data set and then the previous studies in the literature.
Our results display varied effects of RE incentive schemes on different kinds of RES-E for the countries analyzed. Within this framework, TAX, GRANTS, and R&D policies are found to be most effective tools for RE deployment in analyzed countries. This implies that among the others, fiscal and financial instruments are generally more effective than other kind of incentive tools in energy sector. This is because such incentives reduce the installation and operation cost of power plants. Moreover, market-based incentives such as certificates and POL design also have enhancing effect on incentivized RES-E capacity. Our results reveal that the RE policies in general have contributed to RE capacity expansion; however, net metering, DIR, and loan have no desired influence on the RE deployment. Since the effects of infrastructure investments will be seen in the long term, the effect of DIR may have been meaningless. Like loan and net metering, FIT has no significant effect on total RE except for bioenergy and solar. The amount of the expenditures and the significance of policies might not be high enough to stimulate the development of RES-E. Furthermore, regulations and the direct investments create deterrent impact on RES-E capacity. It seems that regulation does not ensure reliable and long-term signal for RE investors. Our results highlight the importance of RE incentive tools that will reduce the cost of RE investments in terms of the success of RE mechanisms. In addition, all RE incentive mechanisms should be supported by transparent, stable, and effectively designed policies. Efficient policy design should also consider which of the incentives are compatible or supportive of each design.
Dynamic panel estimations indicate that capacity of RE in the previous period has positive and significant stimulating effect on the current RE capacity. Moreover, our estimation results highlight that fossil energy consumption, nuclear energy, and GDP are important drivers of the RE deployment while net import (energy security) and CO2 emissions are not. Our results show that the fossil fuel lobby is not very effective and concerns about nuclear power are quite strong in analyzed countries. Interestingly, the increase in GHG emissions cannot create a strong incentive for RE investments in the analyzed counties. Moreover, richer countries are in a better position in the field of green energy transformation. The fact that RE technologies have relatively high cost and cannot compete with traditional energy technologies without any supporting policies may have been effective in the emergence of this result. These results are largely in line with the results of the panel fixed effect estimation.
Our findings reveal important policy implications. Since financial and market-based incentives are found to be quite effective, these incentives should be applied more widely, especially in countries that have not adopted them yet. In this regard, the inefficient incentives (such as DIR or loan) should be phased out because of the limited financial opportunities, especially in this crisis period or these incentives should be reformulated in order to overcome market failures and barriers. However, it should be noted that some policy measures (e.g., loan and direct investment, regulation) are found to be effective only for some specific RE sources; governments can prefer to adopt different incentive schemes for different RE sources. Furthermore, our results highlight that technology-push policies pose critical role in expansion of RE in the energy market. Governments should spend much more on the innovation projects. Moreover, policy makers should provide highly reliable, consistent, and transparent environment to attract the investors to the RE sector. Skewed regulatory framework such as delays and bureaucracy can hamper the penetration of RE into energy market. There is an urgent need for an investment environment which promotes investments and lowers the risk in the RE sector.
Our empirical results highlight that increasing CO2 emissions is not an important factor to the development of RES-E in EU countries. This finding points out that economic concerns are dominant than environmental awareness and EU should adopt more stringent regulations that stimulates RE development. In this context, governments should adopt rationally RE policies that decreases uncertainty and vagueness in energy markets and reduces the cost of RE power plant investments (instruction and/or operation cost).
Last but not least, we suggest that Turkey should start to implement incentive mechanisms which are found to be effective on the RE deployment in the EU countries. Adoption of these RE incentives by Turkey may contribute to full membership process.
Although our study provides insight into which incentive mechanisms are effective or not, it does not provide information about underlying reasons. Moreover, since RE incentive policies do not have a long history, the availability of data was another limitation of our study. We were unable to include qualitative data on how renewable energy incentives were implemented and under which conditions by policy makers in each country. We only focused on whether the relevant incentive was applied or not. This situation constitutes another limitation of our study as well. Hence, there is still further empirical research to be done on the efficacy of the EU countries’ incentive policies on the RE capacity. For example, in order to determine reasons behind the failure of implemented policies, additional research projects should be conducted on firm level. Further empirical research could also examine whether specific incentive policies are more effective at promoting RES-E capacity for different RE sources such as wind, solar, or bioenergy. Moreover, it can be expected that the impact of RE policy schemes is not strong due to the fact that hydropower is not incentivized. Therefore, future research should investigate the results of incentives on both hydro-included and hydro-excluded RES-E capacity expansion for a better understanding of this issue.